
The following is a detailed analysis of my Training Peaks Performance Management Chart for the year 2011. If the above sentence seems obscure, I advise you to stop reading right now, as the following might as well be written in Sanskrit or Mandarin. I plan to write an English translation of this tomorrow, to explain what this all means for me and my past, current, and future triathlon training and performance. But to get there, I had to do a data drive and analysis in the original language. For one thing, I start immediately with acronyms which might as well be Greek. So tri-geeks, proceed, all others, come back tomorrow.
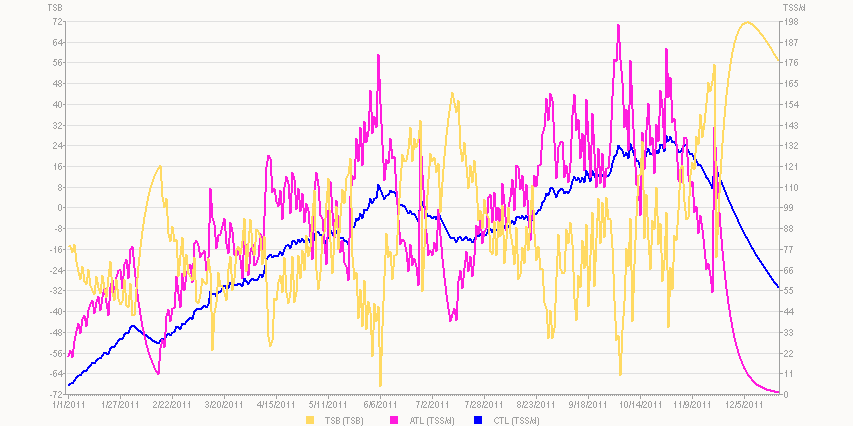
On this PMC, X Axis is time: basically, 2011. Y axis shows both Training Stress Balance (Left scale, yellow) and Training Stress Scores per day (Right Axis, for CTL [blue] and ATL [purple]). NB: this chart does not include swims; I could go back and add each as a manual entry, but who has the time or patience for that? Maybe later, to demonstrate the value (or lack thereof).
First point: when creating a PMC, its important to not only set the date range, but also the starting values for CTL and ATL, as well as the # of days back the algorithm looks for TSS in each of those. In my case, I use the default 42 days for CTL and 7 days for ATL, and have the luxury of starting each from zero, as I was laid up following a bike accident from Sept 17 >> Dec 15 2010, doing absolutely NO training. So this chart represents someone coming entirely “off the couch” into a training year. You set these in the Options menu. upper right of the graph.
First month (January): I followed the OS plan religiously, and show a steady rise in CTL and ATL, with my TSB dropping down to -40 in the process. Learning: a steady rise is much better than plateaus, dips, or rapid rises in CTL. Those indicate an inconsistent training pattern and/or doing too much, too soon, both of which can lead to injury, burn out, and poor improvement.
February: The first two weeks, I went skiing, which (at least in 2011) has no TSS value, so TSB rises way up to +16, and CTL/ATL drop.
Feb/March/: Back on track with the OS, again showing a fairly steady rate of rise. Weekly TSS for the OS is usually (for me) 500+/- The end of March, I switched over the the IM plan for IM CDA end of June. I celebrated this milestone with a 5K race on March 26. You can see a little lull there indicating a little taper and rest afterwards, as well as the recommended “transition” week of relative recovery. ATL. ATL drops, CTL plateaus, and TSB moves up, but doesn’t crest zero.
April: The big bump up in CTL/ATL early April represents a four-day weekend in San Diego, when I rode 3 days and ran x 2. Steady IM training resumes, with weekly TSS around 800 at this point.
May: Here my training take another lull 5-15, when I do a half marathon (POURING RAIN!!!), and take two days off after, then travel to Colorado a few days later. You notice a sharp rise in ATL/CTL thru June 6th, with TSB dropping down to -72. This period is bracketed by Race Rehearsals at the start and finish if this three week volume pump.
June: I reach my CTL peak of 111 on June 5th (RR#2), making for an average rise of 5.3/week – well within the maximum range of 10 suggested by Friel. My workload drops precipitously, too soon in my opinion, as I attend a wedding on the “Lost Coast” of Northern California, with no bike, no swim, and little running for 5-6 days. By IM day, my TSB is up to +32, having been above – 16 for more than two weeks before race day, too long in my opinion. An important consideration here is how much swimming, running and cycling I was able to do in the six months prior to race day, compared to my usual annual totals: 100000/275000 meters, 1900/4700 mi, 445/1000 mi. So I was way deficient in swimming, a bit down cycling, and OK in running going into the race. I ended up with my slowest IM to that point, punctuated by a very demoralizing swim (for reasons less to do with training than water temp combined with residual injury from bike accident), and a weak bike. The fact that I finished at all was a great victory to me. But I was not done for the year.
July: I had deferred a much needed oral surgery to rebuild my jaw until after the race. That is reflected in the even higher TSB/dropping ATL+CTL in that month. I got back on the horse July 12th, and did a pair of Olys July 23 and 30th.
August/Sept/Oct: After that, there is a steady rise in CTL thru to November, as I prepped for IM AZ. Note the rate of rise is a little less steady than the previous build. First, a plateau about 8-20, as I travel to CO again, Then, a sudden bump as I do a fair amount of biking the first week there. Then another bump in mid Sept as I host an EN flavored camp at my house for about 8 folks. We have a very big bike weekend, not volume, but intensity, doing daily TTs up mountain roads. One final hiccup appears as ATL drops, TSB rises to +24, and CTL plateaus when I get a small bout of Plantar Fasciitis, and take 8 days off from running in an attempt to get my foot race capable within a month.
November: The race was Nov 20, so let’s examine the last three weeks before that to see how things shake out. I do RR#r on Oct 27, and see my peak TSS of 135 shortly thereafter. TSB dips to -46. Over the next three weeks, a gradual taper produces a peak TSB of +56, a drop of CTL to 110 by race day. A blip representing the nearly 600 TSS I racked up biking and running, then a gradual drop to zero when I take a month apparently completely off (actually, I didn’t enter any data in WKO+, but my other training logs claim I did something every day)
This is mostly just a data dump from what I consider a representative year (I wish I could also show 2008-10, but I do not have good power data from that time period). As an addendum, note that I did win my AG that year (KQ), with a CTL peak of 135 not including swimming. And despite the foot injury, I was able to have a respectable run, thanks to the training I had done prior to that time. Volume #s for the 4.5 months prior to this race, to compare to annual totals and CDA build above: 135,000m, 2500 mi, 365 mi. Demonstrating, I believe, the importance of race execution over pure fitness when it comes to finishing an IM run. But also demonstrating the value of swim and bike volume to race performance.
I am sure there are lots of things to learn from these charts that I do not think of. Also, I can create in a similar manner 2012-2014, when things didn’t go quite as well as this year. There may be even more to learn from that sort of a chart. And, putting up current data – 2015 – before race day might help me use PMC on a daily basis to help guide training. I also track informally a multitude of metrics to help manage my training, such as weight changes (along with hydration status as reflected by BF%), sleep amount and patterns, nutrition, and mood. I’m not really a data geek, though, so I don’t formally track those things in a spread sheet, but I do notice a strong correlation between negative changes in them, and what’s happening to the rate of rise of CTL, the absolute as well as relative level of TSB, which are essentially the same thing as knowing with some granularity what’s happening to TSS/Day.